
Three new key performance indicators and enhanced procedures at Uganda’s Joint Medical Stores helped GHSC-PSM monitor the performance of a sub-contract for storage of USAID-funded commodities. This technical brief describes the program’s impact—including new warehousing procedures—and provides lessons learned for those wanting to implement similar changes to warehouse performance management.
Warehousing and distribution performance management is critical to managing an efficient supply chain. In Uganda, the Joint Medical Store (JMS) monitored performance using three key performance indicators (KPIs): inventory accuracy, warehouse product loss, and on-time delivery. However, this system lacked rigor, partly due to a lack of performance targets and no mechanism for root cause analysis to understand the reasons behind performance issues.
In 2021, in efforts to improve its performance management, JMS and the USAID Global Health Supply Chain Program-Procurement and Supply Management (GHSC-PSM) project developed standard operating procedures (SOPs) and three new KPIs—picked, packed, and dispatch accuracy; delivery accuracy; and product loss in transit—for monitoring warehousing and distribution performance.
The new SOPs defined the KPIs, the data to be collected, frequency (bi-monthly for all), and targets for each KPI based on known best practices in public health supply chain management. The new approach also included root cause analysis when performance deviated from the target.
JMS developed tools for capturing data necessary to measure the KPIs and provide periodic indicator reports.
The customer service manager at JMS oversees every step in the process for each KPI. They are also responsible for reporting the results and analysis of any deviations from the target to the customer service director. After each distribution cycle, GHSC-PSM and JMS discuss the causes for any deviations from the target and devise mitigation strategies to align actual performance to the targets.
Table: Key performance indicators for Joint Medical Store
|
KPI |
Target |
Purpose |
Calculation formula |
|
Inventory accuracy |
99.9% |
Assesses the accuracy of product quantity when comparing system records to a bi-monthly physical stock count. This indicator tracks at a macro level product loss due to theft or unexplained loss within the warehouse. |
Total number of products (lines) included in the stock take – number of products (lines) that have a variance / total number of products (lines) included in the stock take X 100 |
|
Product loss due to theft, damage, or expiry at the warehouse |
0.01% |
Measures the percentage of products damaged, stolen, or expired while being warehoused in JMS’ custody compared to system records, physical cycle count, and good inventory management practices. |
Total value lost, expired, and damaged / total inventory value on the day of stock take X 100
|
|
Picked, packed, and dispatched (PPD) accuracy |
100% |
Measures the accuracy of product quantity per batch picked, packed, and dispatched compared to the picking list. This is done by selecting a sample of approved picking lists per distribution cycle and comparing quantities on the list with quantities picked and ready to be packed for dispatch. |
Number of packing lists with items correctly picked and ready for dispatch / total number of picking lists sampled X 100 |
|
Delivery accuracy |
100% |
Measures the number of correct service delivery points receiving the correct quantity of product. This is done by reviewing all proof of deliveries (PODs) in the Logbots system for correctness of deliveries. |
Number of service delivery points receiving the correct quantity of project per delivery documents / total number of deliveries X 100 |
|
Product loss (damage, theft) in-transit |
99.9% |
Measures the conformance of stock (value) delivered at service delivery points in acceptable quality versus the total stock (value) dispatched. This is done by reviewing delivery notes (DNs) and PODs at the end of the delivery cycle to identify any comments or remarks by recipients or transporters. |
The total value of all loading lists in the delivery cycle – value of items lost / total value of items X 100
|
|
On-time delivery |
99.9% |
Measures conformance of the number of deliveries successfully made to service delivery points as per published delivery schedules. |
Number of drop-off points that received their deliveries before the deadline / total number of delivery points served in the cycle X 100 |
JMS and GHSC-PSM chose the six indicators to identify errors in warehousing operations and dispatch at the earliest stages in the process. In addition, the Inventory Accuracy KPI reinforced the practice of cycle counting at JMS, with counting every two months during the distribution cycle.
JMS started monitoring the indicators with distribution Cycle 1 of 2022 (January-February) through the most recent Cycle 2 of 2023 (January-February).
Results
Overall, performance against set KPI targets was acceptable over the eight distribution cycles. For example, based on JMS’ profit and loss analysis report for July 2021 to June 2022 and July 2022 to June 2023, the average number of units handled by JMS (received and dispatched) per month increased from 5.32 million to 6.48 million. At the time of significant increase in work volume, the KPIs “Picked, packed and dispatched accuracy” and “Delivery accuracy” remained within a very satisfactory range of performance. JMS continued to devise mitigation strategies to align actual performance to the set targets. Below is a summary of performance over the eight cycles.
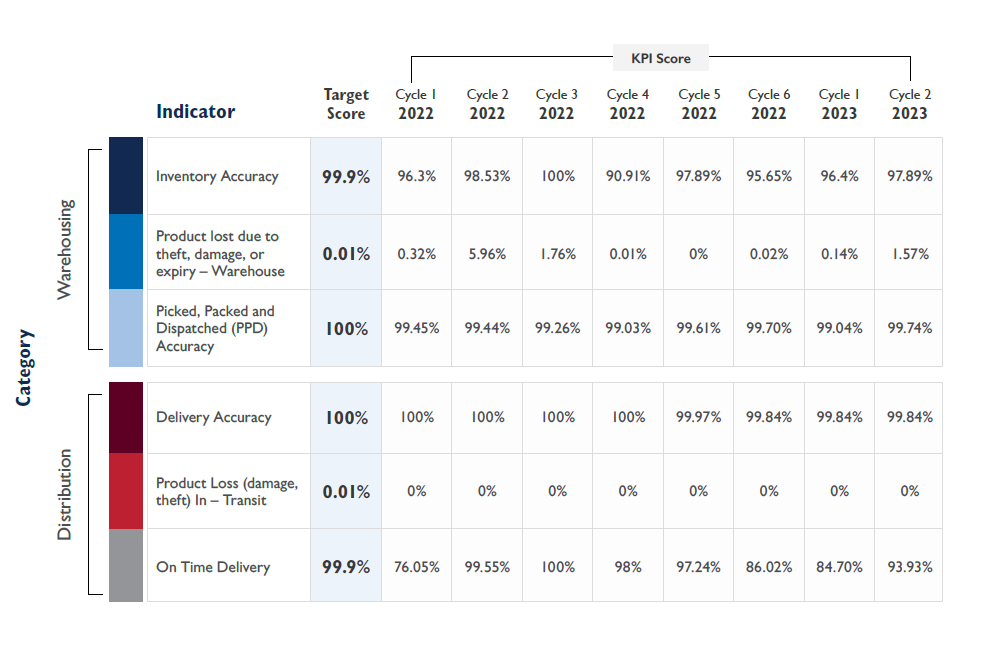
Inventory accuracy
Performance was consistently close to the target, slightly increasing as of Cycle 1 2023. Counting errors during the stock-taking exercise was the recurrent cause of inventory deviations. The JMS team usually resolved the errors after investigations and subsequent recounts. The mitigation plan was to provide continuous training for the counting teams.
Product loss at the warehouse
The highest percentage of commodities lost due to expiry was due to overstock caused by the transition to new drug regimens. For example, Lopinavir/ Ritonavir 100/25mg tabs expired mainly due to the transition to dolutegravir 10mg tabs. Since the underlying cause of expiry was beyond JMS’ influence, there were no corrective actions for JMS. In the future, improved forecasting and supply planning by teams managing product transition could help reduce expiry.
Picked, packed and dispatched (PPD) accuracy
Performance was usually close to 100 percent, with deviations caused by human error during the picking process. However, JMS has a self-correcting system for checking each order before delivery to facilities that usually correct errors in the central warehouse. In addition, JMS conducted additional training with the picking team.
Delivery accuracy
Performance was almost consistent at 100 percent. However, four incidents occurred when a few packs of commodities were damaged in transit or short-delivered. JMS addressed variances by delivering replacement stock to affected facilities.
Product loss in transit
JMS remained consistently within target except for one incident when a vial of Bupivacaine HCl was damaged in transit to a health facility. JMS replaced the vial.
On-time delivery
Performance against the target varied greatly from cycle to cycle and was significantly off-target for several cycles. The predominant cause for below-target performance was receiving health facility orders later than reporting deadlines, which resulted in late delivery to some of those facilities. Most of the late-reporting facilities were new JMS clients, having transitioned from other implementing partners. JMS trained these facilities and oriented them to JMS’ delivery schedules to help them adhere to reporting deadlines. Notwithstanding the late orders from facilities, JMS could still deliver within 14 days of the scheduled delivery dates.
“The KPI tracking has been in line with Joint Medical Store Strategy Objectives, and this activity has helped us improve our inventory management.” (Paul Senyonga - Manager Customer Services, JMS)
Corrective actions
The monitoring of KPI’s prompted JMS to rethink and adjust its operations. For instance, for Picking and Packing process, the team handles a certain number of orders together (known as a wave) to enhance efficiency. However, errors in picking were attributed to staff having difficulty processing a large number of orders within each wave. To reduce errors, the JMS operations team is currently working to determine the optimal number of orders to include in a single wave.
Delivery Accuracy and Product Loss in Transit performance is based on confirmation by recipients at the time of delivery. However, health facility staff identified some discrepancies much later when carefully reviewing the delivery documents compared to the quantities delivered. To address this, JMS plans to introduce an e-feedback management system to replace the current paper-based feedback system, which is slow in providing and analyzing data.
Lessons learned
The entire performance management process should aim to stimulate improvement in procedures. GHSC-PSM and JMS succeeded in developing a more rigorous process improvement and performance management system. The bi-monthly review of KPIs and root cause analysis have become reliable components of the JMS’ organizational culture. The selected KPIs worked well, and GHSC-PSM saw no need for changing or adding to them. Following the program’s success, GHSC-PSM introduced performance-based incentives in Fiscal Year 2023. JMS receives a quarterly management fee when it meets performance targets for two indicators: Product loss in the warehouse and Delivery accuracy.
Lessons learned from this activity fall into two general categories:
1. Collaboration and transparency
Include key warehouse staff from the beginning of design and implementation of KPI-based performance management for warehousing and distribution. To choose and design KPIs, warehouse management and staff can advise on which activities they carry out and at what frequency.
Train team members to understand the purpose of KPI-based performance management. Team members involved in compiling the report at the warehouse and the team receiving and reviewing the data must understand the expected frequency and timelines for information, the specific KPIs to be measured, and the data sources.
When there is a shortfall in meeting targets, warehouse management should explain the reasons and propose ways of improving the process to prevent recurrence. The approach should be collaborative and not punitive to promote a free flow of information, especially when the warehouse is not meeting targets.
Take a hands-on approach. GHSC-PSM found it helpful to go to the JMS warehouse when reviewing performance and determining corrective action, allowing teams to speak to staff and thoroughly understand processes and potential ways to improve them.
2. Quality, accuracy, and integrity of KPIs and data
Discourage pre-emptive corrective actions. At times, staff in charge of documenting process errors may correct the errors (in picking and packing, for example) and then, after correcting, not report them. Although well intended, this behavior eliminates the possibility of correcting errors by addressing root causes.
Clearly define KPIs, including the objective, numerator, denominator, target scores, and measurement frequency. Rigorous KPI review and understanding the reason for each helps ensure buy-in and motivation for the performance management process.
Identify the precise sources for extracting data. GHSC-PSM and JMS sometimes realized they were unaligned in understanding data sources. Identifying and agreeing on data sources helps reduce confusion and errors during implementation. In addition, obtaining data from the primary source in the most granular form is helpful when conducting a root cause analysis and determining corrective actions.