Monitoring customer satisfaction to respond to the voice of health facilities: Experience from Ethiopia

Sub Title
New Insights and Approaches: Article 4
Date
Lead Paragraph/Summary

In this new series from GHSC-PSM, we are sharing recent insights and lessons learned from across our country programs. In this fourth and final article, we discuss how an annual customer satisfaction survey, and a web-based customer feedback monitoring system are helping the Ethiopian Pharmaceutical Supply Service listen to the voice of health facilities and respond to their needs. 

Measuring customer satisfaction with a company’s services and products and how well they meet customer expectations can be vital to the business’ success. Similarly, as a key performance indicator, customer satisfaction could be an important measure of service delivery performance for public health commodities and, if adequately monitored, can guide improvements in the overall performance of the supply chain. However, most public health logisticians and supply chain management organizations lack a routine customer satisfaction measurement system.

The Ethiopian Pharmaceutical Supply Service (EPSS) is responsible for procuring and supplying quality-assured and affordable health commodities for public health facilities in Ethiopia. Currently, the organization has 19 hubs located throughout the country that serve more than 4,060 health facilities that, in turn, serve more than 114 million people. The health facilities’ demand for quality products and dissatisfaction with the EPSS increased in the past years, and some facilities raised concerns about product availability, responsiveness, and communication with EPSS. However, until 2019, the EPSS had no proper customer satisfaction and feedback tracking mechanism to determine how happy customers were with the products, services, and capabilities of the organization, and how to best improve services and relationships with them. 

Paragraphs
Heading
Establishing an annual customer satisfaction survey and a web-based customer feedback monitoring system for the EPSS
Body

In 2019, the EPSS, in collaboration with the USAID Global Health Supply Chain Program-Procurement and Supply Management (GHSC-PSM) project, established two tools to track customer satisfaction: an annual customer satisfaction survey and a web-based routine customer satisfaction monitoring system which is used to collect feedback when exiting after receiving services at EPSS branches. 

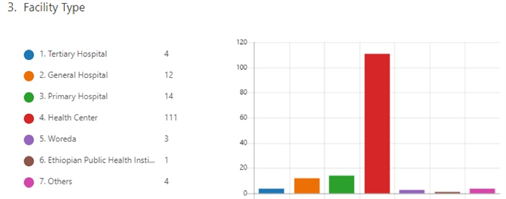
The EPSS conducts the annual customer satisfaction survey among a randomly selected representative sample of 30-35 percent of the total health facilities (a minimum of 35 percent of hospitals, 30 percent of health centers, and 30 percent of woreda health offices; i.e., around 700 health facilities in total), proportionally allocated in all the hubs located across the country. Customers—pharmacy department heads or health facility managers—are interviewed to provide feedback regarding the services they get from the EPSS hubs. ​​EPSS staff administer a paper-based structured survey questionnaire containing 23 Likert-type scale questions (answers should be provided on a 1-4 scale, where 1 indicates strongly dissatisfied and 4 strongly satisfied) to rate the EPSS based on key attributes of supply chain management such as reliability, responsiveness, capability, flexibility, and price. In the survey, customer satisfaction aligns with the attributes of the Supply Chain Operations Reference Model (SCOR, see Box I for additional resources), which comprise reliability, responsiveness, and adaptability. The survey also includes an open-ended question about the strengths and weaknesses of EPSS with respect to pharmaceutical supply management.


The survey questions fall into four thematic areas to understand the perception and experience of health facilities: 

  • supply chain performance
  • customer relationship management 
  • EPSS contribution to build health facilities capacity
  • overall satisfaction

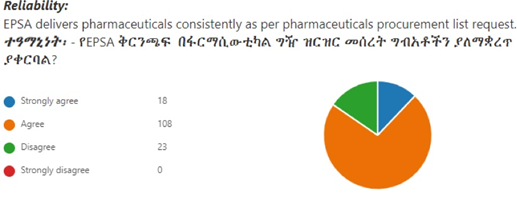
In this way, the questionnaire provides health facilities’ reflections on key attributes of supply chain management, which help to triangulate health facilities satisfaction with quantitative findings from key performance indicators of the EPSS. For example, the health facilities experience on the reliability dimension “How would you rate EPSS consistent delivery of products per required quantity?” is triangulated with the key performance indicators line fill rate, order fill rate, and stockout rate to make informed decisions. The questionnaire is also designed to understand customer satisfaction for specific products—such as medicines, chemicals, or equipment—that could help target specific areas for improvement. 

The EPSS uses SPSS statistical software version 25 to analyze the data collected in the annual survey and calculate descriptive statistics. The overall satisfaction is computed using the total sum of scores of satisfaction for each customer, calculated by adding responses to all survey questions. In this way, health facilities are classified as “satisfied” (or “not satisfied”) if the average health facility satisfaction is above (or below) a calculated threshold [threshold = (maximum score - minimum score) / 2].

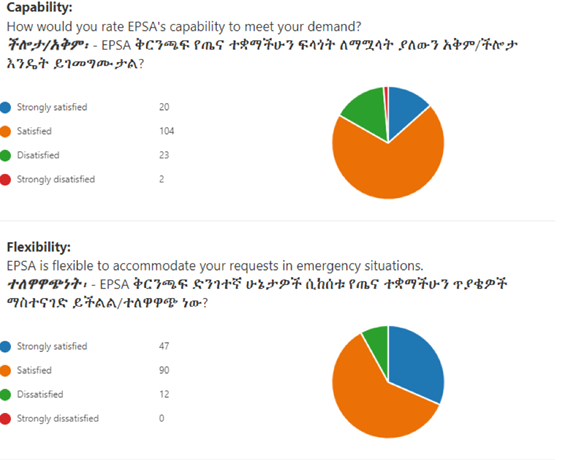
 In addition, EPSS and GHSC-PSM have developed a web-based customer satisfaction and feedback collection system (link in Box I) to obtain real-time feedback immediately after customers get service at the EPSS hubs. The system uses a self-administered online data collection system created with Microsoft Office Forms both in Amharic and English. All customers receive the URL for the customer satisfaction survey questionnaire that can be accessed through their phone or computer browser. The web-based system contains a total of 11 Likert-type scale questions to rate the EPSS accessibility, capability to avail pharmaceutical with fair price, reliability, responsiveness, and flexibility to meet customers’ demand. The system also has an online reporting dashboard showing a summary and visuals of the results for each of the 17 questions. Raw data from each hub are exported to SPSS software for further analysis, but national aggregated results are currently unavailable. 

Image
Example screenshots of the web-based dashboard from the Adama hub.
Image
Example screenshots of the web-based dashboard from the Adama hub.
Image
Example screenshots of the web-based dashboard from the Adama hub.
Heading
Recent findings and impact of the annual satisfaction survey
Body

The annual satisfaction survey helps to understand how well the organization is functioning according to customers’ perception and how to improve service delivery performance and relationship with them. Notably, the survey provides input for EPSS to design interventions towards the questions raised and take actions to ensure an uninterrupted supply of quality pharmaceutical at an affordable price. Some of the interventions include optimization of warehouse operations to reduce order turnaround time and efforts to improve communication between hubs and health facilities about data visibility on stock status. Furthermore, continuous monitoring of customer satisfaction helps take corrective action to meet their expectation and enhances collaboration and active engagement with the customers, EPSS, and health administrative units and, ultimately, contributes to improve customer services. 

The EPSS annual satisfaction survey showed that health facilities’ satisfaction reached 75 percent in fiscal years 2019 (FY2019) but decreased to 68 percent in FY21. This was primarily due to the low refill rates caused by unstable security conditions in Ethiopia, the impact of restrictions on transportation and procurement of health commodities due to the COVID-19 pandemic (since more than 85 percent are imported), and the price inflation also affecting availability of health products. In the survey conducted in 2022, overall satisfaction was relatively good (79 percent), although it had significant variation among hubs (range of 47 percent). The satisfaction of customers on pharmaceutical availability was significantly lower (71 percent) than satisfaction on customer relationship management (94 percent) and showed significant variations from hub to hub. Besides, the overall satisfaction of customers with EPSS services varied greatly from region to region, with those from Gambella and Amhara regions being the most satisfied and those from Afar, Benishangul, and Harari regions the least satisfied. Regional differences in fulfilling customers’ needs are mainly due to variation in the capacity, responsiveness, and service provision across the corresponding supplying hubs. 
 

Image
Overall customer satisfaction bar chart on EPSS services in 2019, 2021, and 2022
Overall customer satisfaction on EPSS services summarized by hub in 2019 (blue), 2021 (gray), and 2022 (red) surveys. Columns on the right indicate the national aggregate. Note: Addis Ababa 2 hub was not included in the 2019 survey, while Dessie hub was
Body

In 2022, the overall satisfaction levels of customers by supply chain attributes were high regarding price (88 percent) and flexibility (77 percent). In contrast, customers were less satisfied with reliability in delivering pharmaceutical consistently and medical equipment installation and functionality (67 percent satisfaction), and capability in terms of people, process, and infrastructure to perform supply chain services (55 percent). On the other hand, perceived accessibility of hubs to the health facilities and annual commodity quantification being conducted by the facility significantly impacted the level of customer satisfaction. When customers perceived hubs as easily accessible and the facility conducted annual commodity quantification, the level of customer satisfaction was higher. This latter relationship could be explained because facilities that conduct proper quantification and forecasting have defined demand, which helps the EPSS to provide commodities based on that demand, ultimately resulting in improved customer satisfaction.

The current system presents some limitations since the annual survey only includes the minimum number of facilities recommended by the World Health Organization (due to time and cost constraints) and does not include health centers that indirectly receive products from EPSS via WoHOs. Also, a potential recall bias (i.e., when the results of a study are skewed due to a subject's memory) may impact the obtained outcomes, since the survey is conducted annually. However, the available results confirm the utility of this monitoring system as a platform to understand the performance of EPSS from the customers’ perspective, which in turn has resulted in informed decisions and actions to improve customer services. For example, the EPSS improved responsiveness by reducing order turnaround time from three days in FY20 to two days in FY21.

The main recommendations for the EPSS derived from the 2019-2022 surveys include: 

●    improving the responsiveness and capability to ensure consistent and timely delivery of products in the necessary amounts by enhancing the forecasting/quantification, procurement process, inventory management, and distribution (product delivery) mechanism both at central EPSS and hubs,
●    taking actions to reduce the observed variation in overall customer satisfaction among hubs and improve the capability and reliability; for example, ensuring equitable distribution from the central warehouse to all hubs to improve product availability and avoiding delays related to order processing (from receiving to dispatch),
●    improving communication with customers; for example, by using a customized platform to make EPSS’ mission clear, 
●    fully implementing the online feedback collection tool at all hubs to reduce potential recall bias, and
●    applying an in-depth qualitative approach to identify the root causes of customer dissatisfaction, and then designing tailored interventions to improve areas of dissatisfaction.

Importantly, each hub has its own recommendations and plan of action for improvement based on the findings of the surveys. The findings and recommendations are being used as input to design interventions to improve the supply chain management system. Most of the EPSS hubs are implementing different initiatives to improve their responsiveness and timeliness to meet customers’ demand and expectations. For instance, almost all hubs are implementing a perpetual inventory system to improve inventory accuracy—including the volume or stock status, location, and expiry date of products in the warehouse—that in turn can enhance order picking accuracy. As a result, most of the hubs have improved the order processing time.

In addition, the EPSS has exerted enormous effort to ameliorate its procurement system to reduce the procurement lead time (i.e., number of days elapsed from request date up to the receiving). This has contributed to a slight improvement of product availability.

Furthermore, the hubs have been implementing quality management system, warehouse optimization, and fleet management optimization (route optimization to ensure timely delivery of products to health facilities) interventions to improve the overall supply chain management system.
 

Heading
A user-friendly system that can be replicated in other settings
Body

Notably, the web-based monitoring system has been designed to be easily repeatable and scalable. It was first piloted in two EPSS hubs and then quickly replicated in 14  additional hubs with minimal resources. Likewise, the system can be replicated in other similar contexts, thanks to the use of an open-source application that can be easily customized even by staff with basic information technology knowledge since it does not require programming or advanced expertise. Also, the system is user-friendly and easily accessible through any browser using a computer or smartphone with an internet connection (it does not require additional software). Finally, since the reporting dashboard produces a summary of the results with graphs and charts, anyone without advanced data analysis skills can use the system, and the ratings are aligned with the internationally accepted SCOR, which can be used in any context.